

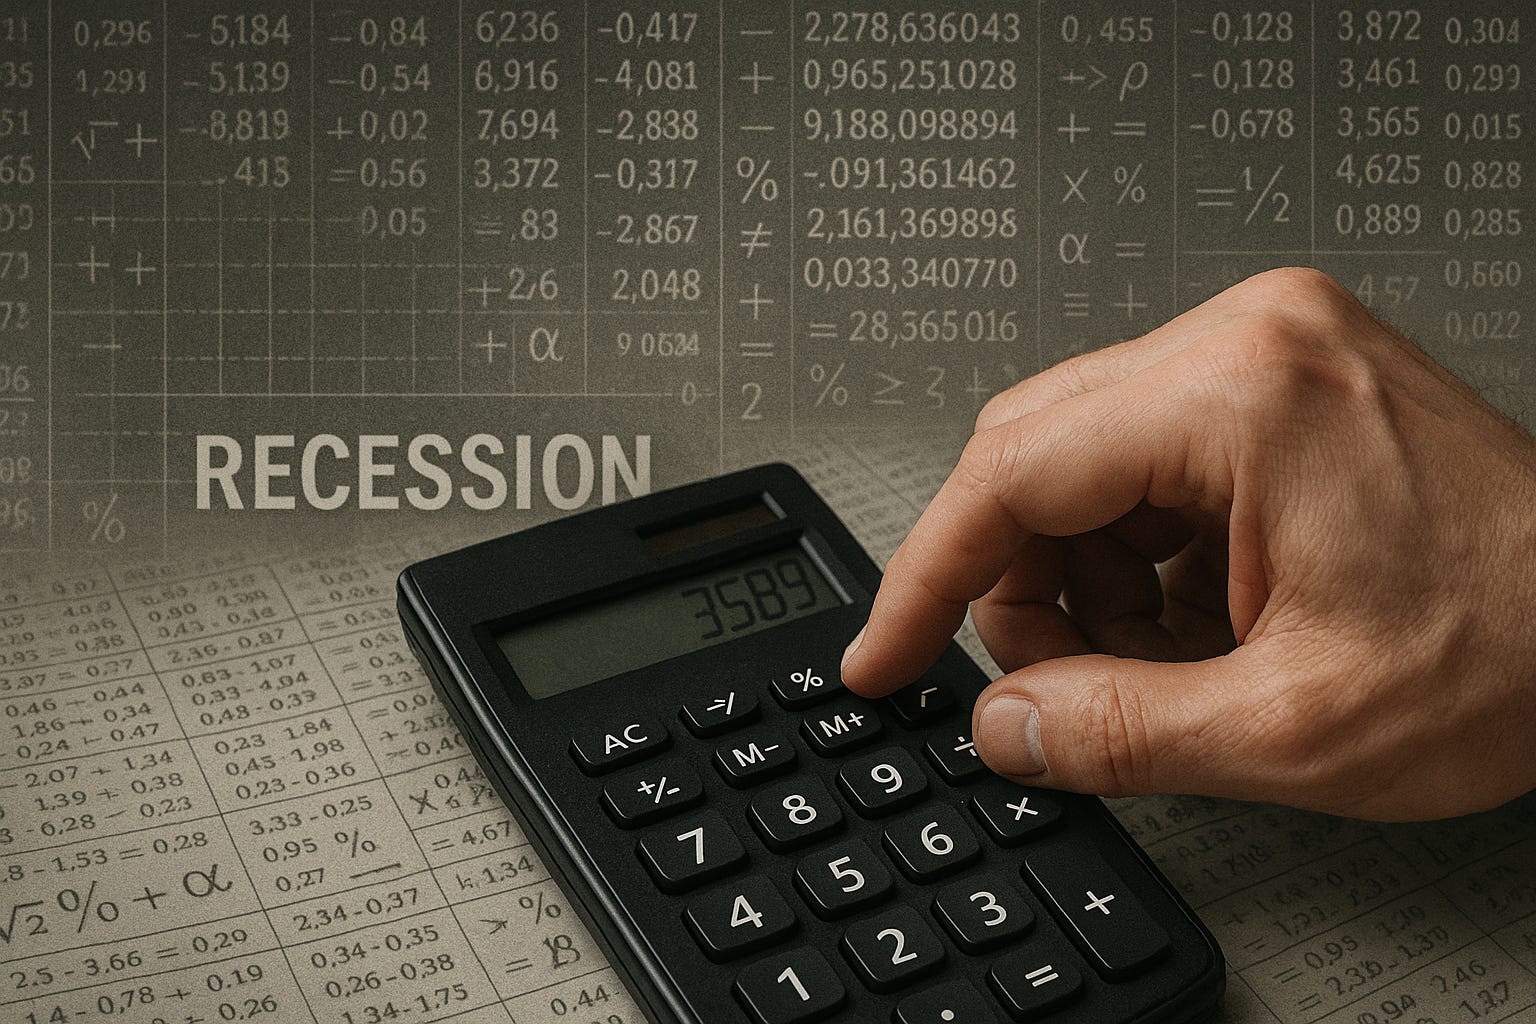
How To Predict a Recession
Everyone from Wall Street to Main Street is calculating the chance of recession. Here's your chance to do the math.

Are we on the brink of a recession?
Recession Predictions
The latest predictions on the probability of a U.S. recession in 2025 reflects a divided view among major institutions and researchers, with most forecasting a reduced (but still significant) risk compared to last year.
The consensus among major banks, academic models, and economic forecasters is that the current probability of a U.S. recession in 2025 ranges from 30 to 40%. While some models and commentators cite higher numbers, the hard data, supported by job growth and moderate GDP projections, suggests the most likely scenario is slow growth rather than a sharp downturn.
J.P. Morgan recently lowered its probability estimate for a U.S. recession in 2025 from 60% and now pegs the chance of a U.S. recession by the end of 2025 at about 40% (J.P. Morgan)
UBS, a global bank, puts the odds at over 90% based on trends from May to July
September’s Consumer confidence report dropped to its lowest since April, and the share of Americans expecting a recession in the next year is at its highest since May (Conference Board, PBS)
S&P Global Ratings currently sees about a 30% chance of a U.S. recession within the next 12 months, citing persistent below-trend growth and policy uncertainty (S&P Global)
UCLA Anderson’s Recession Watch notes there are “no signs of an imminent recession” as of early 2025, with steady job growth and a stable unemployment rate (UCLA Anderson Forecast)
Market-based prediction platforms and Wall Street economist surveys generally cluster around a 30-40% probability, with some sources—like UBS—reporting occasional spikes in recession risk sentiment up to the 90% range, though these are outliers and usually tied to specific negative economic data releases (Polymarket; Newsweek)
Academic sectoral analyses (using indicators like the Sahm Rule and yield curve inversions) point to a recession probability ranging from 44–53% (SSRN).
How Do They Reach These Conclusions?
The truth is that the probability of a U.S. recession is rarely a single, agreed-upon number. It’s a forecast based on different models, data inputs, and expert judgment. And it can change, like the weather.
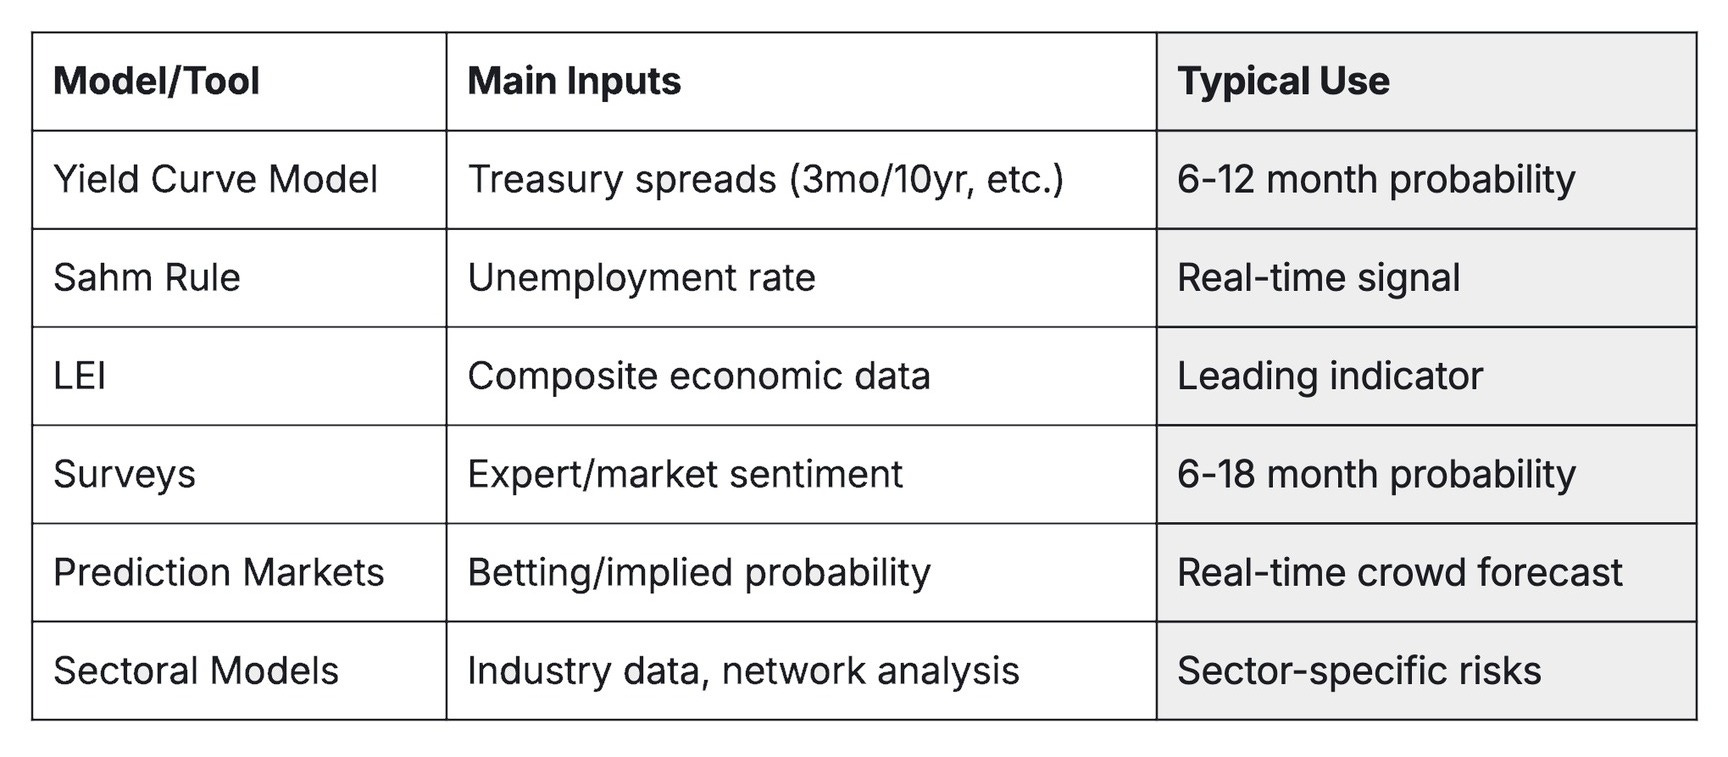
Here’s how the major institutions and economists typically arrive at their recession probability estimates, and the main tools and indicators they use:
1. Yield Curve Models
What it is: The yield curve plots interest rates for government bonds of different maturities. The “spread” between short-term and long-term interest rates (like the 3-month vs. 10-year Treasury) is closely watched.
How it works: Historically, when short-term rates exceed long-term rates (“yield curve inversion”), it often precedes a recession.
Calculation: Economists use statistical models—often logistic regressions—to estimate the probability of recession 6-12 months ahead based on the current yield curve spread. The New York Fed’s model is a prime example (NY Fed PDF).
Tool: Federal Reserve models, Bloomberg Terminal, FRED (Federal Reserve Economic Data).
2. The Sahm Rule
What it is: A simple rule using the U.S. unemployment rate. If the 3-month moving average of unemployment rises by 0.5 percentage points or more relative to its low over the past year, it signals a recession.
How it works: This rule is less about predicting and more about triggering a recession signal in real time or with a short lag (Journal of Applied Business & Economics).
3. Leading Economic Indicators (LEI)
What they are: Composite indexes that combine multiple forward-looking data series (like new manufacturing orders, building permits, stock prices, and consumer expectations).
How it works: A sustained decline in the LEI is often interpreted as a sign that a recession is likely in the coming quarters.
Tool: Conference Board’s LEI, OECD leading indicators.
4. Survey-Based Forecasts
What they are: Surveys of economists and business leaders ask for their subjective probability of a recession within a certain time frame.
How it works: Aggregated results (like Wall Street Journal or Bloomberg surveys) provide median or average recession probabilities.
Tool: Survey of Professional Forecasters (SPF), WSJ Economic Forecasting Survey.
5. Market-Based Models
What they are: Prediction markets (like Polymarket) or analysis of market instruments (like credit spreads, equity volatility).
How it works: Market prices are interpreted as probabilities of recession events, using betting odds or the implied probability from asset prices.
Tool: Prediction market platforms, option-implied volatility models.
6. Sectoral and Structural Models
What they are: Academic or institutional models using sector-specific data (e.g., pension funds, manufacturing, retail, etc.) to identify sector vulnerabilities and contagion risks (SSRN sectoral analysis).
How it works: Uses input-output linkages, stress testing, and contagion simulations to estimate the risk of sector-driven recessions.
7. Composite and Judgmental Forecasts
What they are: Many big banks (like J.P. Morgan, S&P, UBS) use a mix of quantitative models and qualitative/judgmental adjustments from economists.
How it works: These forecasts weigh data from models above, but also factor in current policy, geopolitical risks, and “soft” information from corporate earnings, Fed speeches, and so on (J.P. Morgan, S&P Global).
Summary Table of Main Tools/Indicators:
No single model is ideal. Most prognosticators combine several, weighting their predictions according to current macroeconomic conditions and the reliability of each indicator at that point in the cycle. Sounds simple, huh?!
Give It A Try Yourself
Let’s break down the technical workings and math behind some of the most influential recession probability models and rules using three main approaches: (1) yield curve-based models (like the New York Fed’s), (2) the Sahm Rule, and (3) the composite/leading indicator models. Then run your own calculations and see if your conclusion differs, or is more precise than those referenced earlier in this post!
The Tools
1. Yield Curve-Based Probability Models
How does it work?
The New York Fed and many academic economists use a probit (logistic regression) model to translate the slope of the yield curve into a recession probability.
Mathematical Formula:
The core model predicts the probability that the U.S. will be in a recession within the next 12 months:
[ P(\text{Recession in 12 months}) = \Phi(\beta_0 + \beta_1 \cdot \text{Spread}) ]
( \Phi ) = cumulative standard normal distribution function (probit link function)
( \beta_0, \beta_1 ) = estimated coefficients
Spread = typically the difference between the 10-year and 3-month Treasury yields
Example (from NY Fed, October 2025 PDF):
[ \text{Probability} = \Phi(-0.5333 - 0.6330 \times (\text{10yr} - \text{3mo})) ] Where a negative spread increases the probability sharply.
Data Input:
Daily/Monthly Treasury yields from FRED or the U.S. Treasury.
Reference:
As of today (October 7, 2025), the most recent U.S. Treasury yield curve data shows the following:
10-Year Treasury Yield: Approximately 4.34%
3-Month Treasury Yield: Approximately 4.67%
This results in a yield curve spread (10-year minus 3-month) of about -0.33 percentage points (i.e., the curve remains inverted).
What does this mean?
A negative yield curve spread (inversion) is historically associated with elevated recession risk, especially when it persists over several months. The current reading of -0.33% indicates the yield curve is still inverted, continuing a signal that has often preceded recessions in previous cycles.
Reference:
Conclusion:
Today’s yield curve remains inverted, which is a classic warning sign according to most recession probability models, though no single indicator is definitive on its own.
Deep Dive:
Here’s how today’s yield curve reading plugs into the New York Fed’s widely used recession probability model:
Step 1: Gather the Data
10-Year Treasury Yield: 4.34%
3-Month Treasury Yield: 4.67%
Spread (10yr - 3mo): 4.34% - 4.67% = -0.33%
Step 2: The New York Fed’s Probit Model
The New York Fed model estimates the probability of a U.S. recession within the next 12 months using the following formula:
[ \text{Probability} = \Phi(\beta_0 + \beta_1 \cdot \text{Spread}) ]
Where:
( \Phi ) is the cumulative standard normal distribution function (the “probit” link)
( \beta_0, \beta_1 ) are coefficients estimated from historical data
Recent parameter estimates (from NY Fed’s October 2025 PDF):
( \beta_0 = -0.5333 )
( \beta_1 = -0.6330 )
Step 3: Plug in the Numbers
[ \text{Index} = -0.5333 + (-0.6330) \times (-0.33) = -0.5333 + 0.2089 = -0.3244 ]
Step 4: Calculate the Probability
To get the probability, find the cumulative probability for (-0.3244) in the standard normal distribution:
[ \Phi(-0.3244) \approx 37.4% ]
Evaluation:
According to the New York Fed yield curve model, today’s reading implies about a 37% probability that the U.S. will enter recession in the next 12 months. This is an elevated risk, but not a certainty, and aligns with the “cautious but not dire” outlook of most major forecasts.
Yield curve remains inverted: Still flashing a warning, but less extreme than earlier in the year.
Probability is below 50%: Indicates risk is meaningful but not overwhelming, consistent with recent economic forecasts.
Reference:
2. The Sahm Rule
How does it work?
The Sahm Rule is a “real-time” recession detector based on labor market weakness. It does not predict recessions, but signals when one has likely begun.
Rule:
A recession is signaled if: [ \text{Unemployment Rate}{3\text{-mo avg}} - \min(\text{Unemployment Rate}{3\text{-mo avg, past 12 months}}) \geq 0.50% ]
In plain English: If the current 3-month average unemployment rate rises by at least 0.5 percentage points above its lowest level of the past year, a recession is likely underway.
Data Input:
BLS monthly unemployment rate.
Reference:
Today’s reading for the Sahm Rule Recession Indicator is 0.13 percentage points as of August 2025 (the most recent available update). This means the three-month moving average of the U.S. unemployment rate is 0.13 percentage points above its lowest level in the past 12 months—well below the 0.50% threshold that would officially signal a recession according to the Sahm Rule (YCharts, Trading Economics, MacroMicro).
Conclusion:
The Sahm Rule does not currently indicate a recession is underway in the U.S. as of today.
3. Composite Leading Indicator (CLI) Models
How does it work?
CLIs combine several economic indicators into a single index, which is then used to forecast economic turning points.
Components:
Indicators often include: new orders, building permits, stock prices, consumer expectations, initial jobless claims, etc.
Model:
A composite index is calculated as a weighted average of the standardized input indicators. If the index declines for several months, the probability of recession rises.
[ \text{CLI}t = \sum{i=1}^{n} wi \cdot z{i,t} ]
( w_i ) = statistical weights
( z_{i,t} ) = standardized value of indicator i at time t
Some advanced models use these CLIs as inputs for another probit/logit regression to estimate recession probabilities.
Reference:
The CLI Numbers
Conference Board Leading Economic Index (LEI): The latest figure available is for August 2025, with the LEI standing at 98.4 (2016=100). This represents a 0.5% decline from the previous month, and the LEI has now fallen by 2.8% over the past six months, signaling persistent weakness in forward-looking components of the U.S. economy (Conference Board, Conference Board PDF).
The current readings show continued sluggishness, but not a collapse, in forward-looking economic momentum.
OECD Composite Leading Indicator (CLI): As of August 2025, the latest reading is 100.41, up slightly from 100.35 in July. This modest uptick suggests a stabilization, but the index remains close to its long-term trend, indicating no strong signal for a sharp turn in the business cycle (OECD, Trading Economics).
Interpretation:
CLI at or near 100: Indicates the economy is operating around its long-term average trend. A value persistently below 100 would signal below-trend growth or early warning signs of economic slowdown. A value above 100 suggests above-trend momentum.
Recent movement: The CLI has inched up from 100.35 in July to 100.41 in August, ending several months of stagnation or slight decline. This small uptick can be interpreted as a tentative stabilization (not a robust rebound) after a period of mild weakness.
No clear recession signal: The CLI does not currently signal a sharp downturn or imminent recession. Instead, it shows that the U.S. economy is in a “soft patch”—growing slowly, but not contracting.
Conclusion:
According to today’s latest available OECD data, the U.S. economy is showing signs of stabilizing at trend, with no immediate indicators of a sharp downturn or recession as of August 2025. The CLI will need to move decisively upward or downward in subsequent months to signal a meaningful shift in trajectory.
*The Conference Board typically releases the previous month’s LEI data in the second half of the following month. For example, August data was released in mid-September. The September 2025 figures are not yet available on their website or in financial news as of this morning.
*As of today, the most recent OECD Composite Leading Indicator (CLI) for the U.S. is for August 2025, with a value of 100.41 (YCharts, Trading Economics). The OECD typically publishes monthly CLI updates with a lag. September’s figures are usually released in mid-to-late October. You can check the OECD CLI dashboard later in the month or subscribe to their economic indicator alerts for future updates.
4. Sectoral Contagion Models (Academic Example)
How does it work?
These models use network analysis to simulate how shocks in one sector (like pension funds) may spread to others, raising systemic recession risk.
Model:
Construct a network with nodes as sectors; edges as financial or supply chain exposures.
Simulate shocks; calculate the probability of contagion via Monte Carlo methods or analytical formulas.
The probability reported is the chance that a shock in a vulnerable sector leads to a recession-level event in the broader economy.
Reference:
As of today (October 7, 2025), there’s no single “official” real-time sectoral contagion reading for the U.S. economy—these models are primarily academic and updated less frequently than headline indicators like unemployment or the yield curve. However, here’s what the latest research and commentary indicate:
Latest Sectoral Contagion Model Data (2025)
Recent Academic Findings:
The most recent published academic sectoral contagion models (e.g., SSRN working paper “Sectoral Analysis of Recession Dynamics: Where the 2025 Downturn Could Begin”) estimate a 44–53% probability of mutual contagion among key U.S. sectors—such as pension funds, real estate, and manufacturing—under current conditions (SSRN).Key Inputs:
These models analyze up-to-date financial exposures, input-output linkages, and stress scenarios (e.g., rapid rate hikes or an energy price spike) to simulate how trouble in one vulnerable sector could spread through the economy.No Imminent Systemic Crisis:
Despite heightened sector-specific stress (especially in commercial real estate and some regional banks), there is no clear evidence of active contagion spreading across sectors at this time. Labor markets, consumer spending, and core banking remain resilient, helping to contain shocks.
Conclusion:
Elevated Vulnerability, Not Active Crisis:
The 44–53% “contagion risk” means that, if a major shock hits a vulnerable sector, there is a moderate chance it could spill over to others, raising the risk of a broader recession. But as of today, most sectors are still operating with only isolated stress, and there’s no sign of a domino effect underway.Conclusion:
Today’s sectoral contagion models suggest the U.S. economy is in a “watchful” state:Vulnerabilities are present, especially in real estate and some financial subsectors.
Systemic contagion is possible but not currently occurring.
Continued monitoring is warranted, especially if broader credit stresses or sharp asset price declines emerge.
Reference:
5. Survey/Market-Based Probabilities
Surveys: Median of respondents’ subjective probability that a recession will occur within the next 12 months.
Prediction Markets: Probability implied by betting market prices (e.g., if a “recession” contract trades at $0.35, the market-implied probability is 35%).
Your Prediction
How did you do? Does your conclusion match the experts’? Feeling super smart? Let’s add another layer or two, then!
Here’s how geography and business sector differences factor into recession analysis—and why it’s very possible for some regions or sectors to be in recession while others are not:
1. Geographic Variation: Regional Recessions
How It Works
The U.S. economy is vast and diverse—think Silicon Valley vs. the Rust Belt, Texas oil vs. New York finance.
States/regions can experience very different economic conditions at the same time, depending on their dominant industries, demographics, and external shocks.
Can One Area Be in Recession While Others Are Not?
Yes, in fact it’s common
The National Bureau of Economic Research (NBER) dates recessions for the entire country, but many economists and analysts track “regional recessions.” For example, a region may see declining employment, falling output, and weak consumer spending while the national numbers are still positive.
The Federal Reserve, Moody’s, and other institutions regularly report on state-level and metro-area economic conditions.
Recent Example
As of late 2025, some economists estimate that 22 states plus DC are experiencing persistent economic weakness and job losses, even if the nation as a whole isn’t in official recession (MarketWatch).
Energy price shocks might plunge oil-dependent states into contraction, while tech-heavy or tourism-driven states could be booming or stable.
The “K-shaped recovery” after COVID-19 is a textbook example, with some regions roaring ahead and others lagging badly.
2. Business Sector Differences: Market-Specific Recessions
How It Works
Business cycles can be “asynchronous,” meaning some sectors may contract while others expand.
For example, manufacturing might shrink due to global trade shocks, while healthcare and tech keep growing due to demographic and structural trends.
Can One Business Sector Be in Recession While Others Are Not?
Yes. also common
Economists routinely talk about “manufacturing recessions” or “retail recessions” even when national GDP is positive.
In 2025, commercial real estate and regional banks are under significant stress, while tech, AI, and some consumer services remain relatively strong (SSRN sectoral analysis).
Market indices and earnings reports often show sector divergences. This is one reason why the stock market can rise even if parts of the “real” economy are suffering. There’s been a lot of online discussion on that topic that lately!
Why This Matters
Policy: Federal policy may not fit all regions/sectors. What helps manufacturing states might hurt tech hubs, and vice versa.
Business Strategy: Companies and investors need to assess not just national but regional and sectoral conditions when making decisions.
Personal Impact: Workers and households may experience a recession “on the ground” even if the technical national recession hasn’t been declared.
Conclusion:
Recessions, particularly in a large, complex economy like the U.S., are often uneven. One part of the country or a specific business sector can experience a downturn while others hold steady or even grow. This “patchwork” recession reality is crucial for understanding the true state of the economy and making smart policy, investment, and business decisions. It does make our calculations more difficult, however!
Here are the most recent sourced maps and data showing which U.S. states are in economic contraction or at high recession risk as of October 2025:
State-by-State Recession List (October 2025)
Moody’s Analytics and MarketWatch:
According to Mark Zandi of Moody’s Analytics (follow Mark on LinkedIn), 22 states plus the District of Columbia are now experiencing persistent economic weakness and job losses that are likely to qualify as a regional recession. These states are either already in recessionary conditions or at high risk, according to MarketWatch, Newsweek and MortgagePoint.Zandi’s Strongest To Weakest List:
Expanding: South Carolina, Idaho, Texas, Oklahoma, North Carolina, Alabama, Kentucky, Florida, Nebraska, Indiana, Louisiana, North Dakota, Arizona, Pennsylvania, Utah, Wisconsin.
Recession/High Risk: Wyoming, Montana, Minnesota, Mississippi, Kansas, Massachusetts, Washington, Georgia, New Hampshire, Maryland, Rhode Island, Illinois, Delaware, Virginia, Oregon, Connecticut, South Dakota, New Jersey, Maine, lowa, West Virginia, District of Columbia.
Treading Water: Missouri, Ohio, Hawaii, New Mexico, Alaska, New York, Vermont, Arkansas, California, Tennessee, Nevada, Colorado, Michigan.
A significant portion of the U.S. is experiencing regional contraction, even as the national economy as a whole has not met the NBER’s criteria for a recession.
States with strong exposure to struggling sectors (like energy, regional banking, or manufacturing) are more likely to be in contraction.
The “patchwork” nature of this downturn means local economic conditions may look very different from the national headlines.
For updates, see MarketWatch article and map, Newsweek’s coverage, and state-level economic releases.
Now your calculations will be complete. Or you’ve given up. It’s a lot to consider, right? I know I’m happy to leave this job to the pros. Still, it’s good to have a working knowledge of the way these predictions are devised, and to check in on economic indicators every now and then. Congrats on the effort!
To share this post with someone who has a lot of free time and a fancy calculator: